Introducing the Ecosystem Explorer Project
OpenTelemetry is vast. The Java agent alone includes over 240 different auto-instrumentations. The Collector has hundreds of components. Python, JavaScript, Go, and .NET each have their own ecosystems of instrumentation libraries, each with its own patterns and conventions.
In our 2025 Developer Experience Survey, users said that “documentation is difficult to navigate, requiring users to switch between the OpenTelemetry website and GitHub repositories” and that they often have to “piece together information from various sources.” Only about half of users rely on opentelemetry.io as their primary resource; the rest turn to GitHub, vendor documentation, or wherever they can find answers.
And even when you find documentation, it might not answer the basic question: what telemetry signals will I actually receive? The OpenTelemetry Getting Started Survey found that 65% of respondents wanted reference implementations showing what instrumentations actually produce. As was noted in the OpenTelemetry 2025 Year in Review post, the existing OpenTelemetry Registry helps users discover components, but it “doesn’t always provide the depth of information needed” to answer questions like: Which libraries are instrumented? What spans, metrics, or attributes do they emit? How does that change across versions?
There’s a catch-22 at the heart of OpenTelemetry adoption. To understand what telemetry a component produces (what spans, metrics, or attributes) you often have to deploy it first. That’s a lot to ask of someone evaluating whether OpenTelemetry fits their needs.
We’re building something to fix that. After working on a prototype for about a year, the new site is now live at explorer.opentelemetry.io - but it is very much still a work in progress.
The Java agent ecosystem
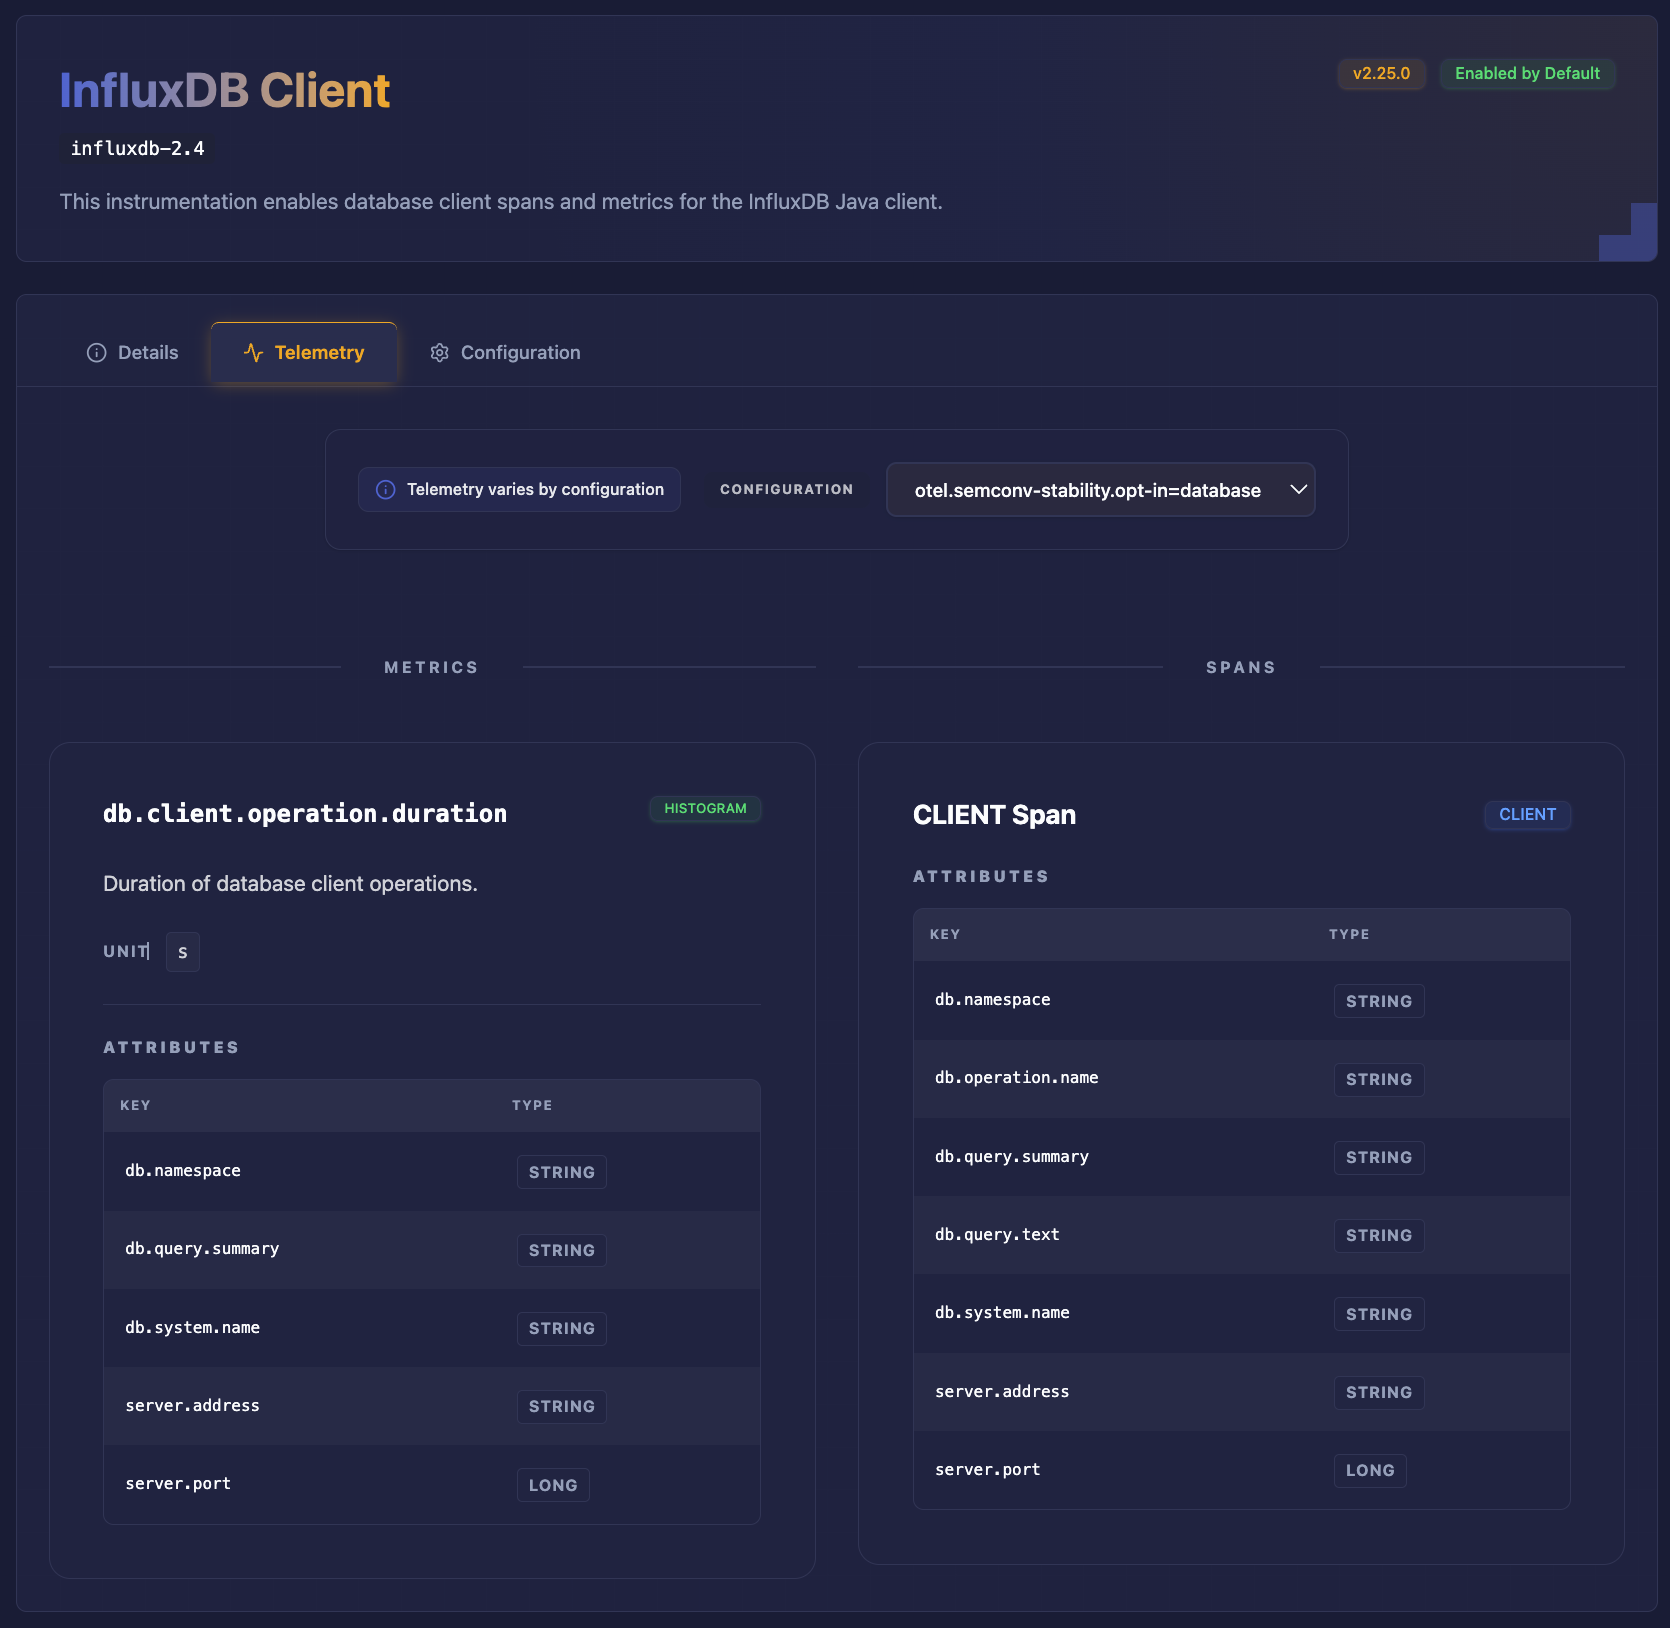
The Java agent is our first fully mapped ecosystem. Over 240 instrumentations are indexed and searchable. You can browse by name, filter by instrumentation type, and drill into detail pages that show exactly what spans, metrics, and attributes each instrumentation emits. Configuration options are documented and mapped to the telemetry they affect.
Version support is built in. The Explorer tracks multiple Java agent releases, so you can see what telemetry a specific version produces, or what changed between versions. This is particularly useful when planning upgrades or debugging why telemetry looks different after a release.
There is automation that runs nightly. When a new Java agent version releases, the pipelines pick it up, extract the metadata, and update the registry. No manual intervention required.
We’ve validated the initial approach with Java. Now we need help expanding to new ecosystems.
The frontier: Explorers needed
The Java agent is just one corner of the OpenTelemetry ecosystem. There’s a vast landscape of other components waiting to be mapped, and each language presents its own interesting challenges.
Expanding Java coverage
Even within Java, we’re just getting started. The Java Agent’s built-in instrumentations are mapped, but there’s more: extensions from the opentelemetry-java-contrib repository, third-party extensions from the community, and native instrumentation built directly into libraries like Apache Camel. Each layer adds coverage that developers need to discover.
Collector components
The OpenTelemetry Collector has its own rich ecosystem of receivers, processors, exporters, and connectors. We’ve already built most of the automation pipeline to extract Collector component metadata. Now we need to build out the web interface to make it all discoverable and searchable. This is close to ready and needs contributors to help bring it across the finish line.
Python instrumentation
The Python ecosystem works differently than Java. Instead of a single unified agent, OpenTelemetry Python is composed of dozens of individual instrumentation packages (Flask, Django, FastAPI, requests, etc.) distributed via PyPI. These packages are versioned and released independently, and while they follow shared OpenTelemetry conventions, consistency in implementation and documentation of emitted telemetry can vary.
There’s still a lot to figure out here: How do we extract instrumentation capabilities from these distributed packages? What metadata schema works for both auto-instrumentation and explicit instrumentation? How do we track changes across dozens of independent release cycles?
JavaScript instrumentation
JavaScript follows a similar pattern to Python, with OpenTelemetry JS maintaining a modular ecosystem of instrumentation packages covering Express, Fastify, and the broader Node.js landscape. However, it also provides aggregation layers (such as auto-instrumentation bundles) that make the experience somewhat more cohesive than Python. The patterns we develop for Python will likely inform how we approach JavaScript, but each ecosystem has its own runtime model and quirks to understand.
GenAI and LLM instrumentation
This is some of the fastest moving, but still uncharted territory. OpenTelemetry is actively working on semantic conventions for generative AI, but the ecosystem is changing fast. LangChain, LlamaIndex, OpenAI clients, Anthropic clients: frameworks are racing to add observability, but there’s no authoritative map of what telemetry each actually emits.
What signals do popular LLM frameworks capture? How complete is semantic convention adoption? What patterns are emerging for tracing RAG pipelines or agent tool calls? These are open questions that contributors could help answer.
Defining the language
Beyond mapping specific ecosystems, there’s foundational work in defining how we describe components. What categories of functionality do instrumentations provide? How do we distinguish between components that emit telemetry, those that enrich telemetry from other sources, and those that handle context propagation? This taxonomy work helps users understand what they’re getting and helps us build a consistent experience across ecosystems. Much of this thinking has already been developed in the Java ecosystem, where a more unified auto-instrumentation model has forced clearer definitions and boundaries. The challenge now is to evaluate how those concepts translate to other ecosystems and identify where they map cleanly, where they need to be adapted, and where fundamentally different runtime models require us to rethink the approach entirely.
Many ways to contribute
You don’t need to be an OpenTelemetry expert to help. The project needs different skills, and there are entry points at various levels.
Product designers and UX experts
The information associated with these components can go deep and be very dense. We are looking for designers and UX experts who can help evaluate our approaches and propose ways to present this overwhelming amount of information to users (and agents).
Research and documentation
Before we can build automation for a new ecosystem, someone needs to understand it. What metadata is available? How is it structured? Where does it live? This is exploration work: surveying repositories, reading source code, documenting patterns. No code required, and it’s a great way to learn OpenTelemetry internals while contributing something valuable.
Python automation
The data extraction pipelines are written in Python. Adding a new ecosystem means writing a new watcher that understands how to pull metadata from that ecosystem’s repositories. If you’re comfortable with Python and interested in data pipelines, this is where building out new ecosystems starts.
Web development
The explorer frontend is React with TypeScript and Tailwind CSS. There’s plenty of UI work: new pages for Collector components, improved search and filtering, version comparison views, accessibility improvements, mobile responsiveness. If you’re a front-end developer, you can make a visible impact quickly.
Join the expedition
Some contributors will go deep in one area. Others will help across multiple. Both are valuable. The codebase is approachable, the maintainers are active, and we’re happy to help people get oriented. Big shout out to the community members who have already contributed to the project in its early stages:
- Pratik Jadhav (@pratik50)
- Luca Cavenaghi (@lucacavenaghi97)
- Adam Silva @adaumsilva
- Manohar Mallipudi (@Vjc5h3nt)
The Ecosystem Explorer is live, the foundation is working, and there’s interesting work ahead. If any of these sound appealing, here’s how to get involved:
- Explore the (work in progress) site: explorer.opentelemetry.io
- Browse the code: github.com/open-telemetry/opentelemetry-ecosystem-explorer
- Find (or submit) issues: Look for “good first issue” or “help wanted” labels. There are quite a few!
- Join the conversation:
#otel-ecosystem-exploreron CNCF Slack - Attend meetings: Communications SIG, Tuesdays 9:00 AM PT (bi-weekly)
Come help us map the ecosystem!